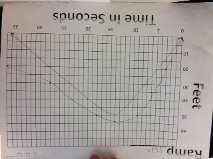
A) My graphs were all pretty close to te actual graph except for the 21" graph. it was different because i didn't find a downward point.
B) the zeros on my graph represent when the skateboard was not moving at all.
C) the zeros are all the same, it is before each of the skateboards start moving. the starting pionts are all similar.
D) the graph rises the fastest when the skateboard speeds up going down the ramp. the graph falls the fastest when it is rolling backwards down the driveway.
E)
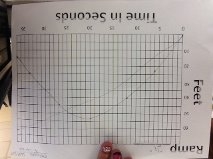

 |  |
 RSS Feed